Tuesday, December 28, 2010
Thursday, December 23, 2010
The Use of Colors on Business Dashboards

Tuesday, December 14, 2010
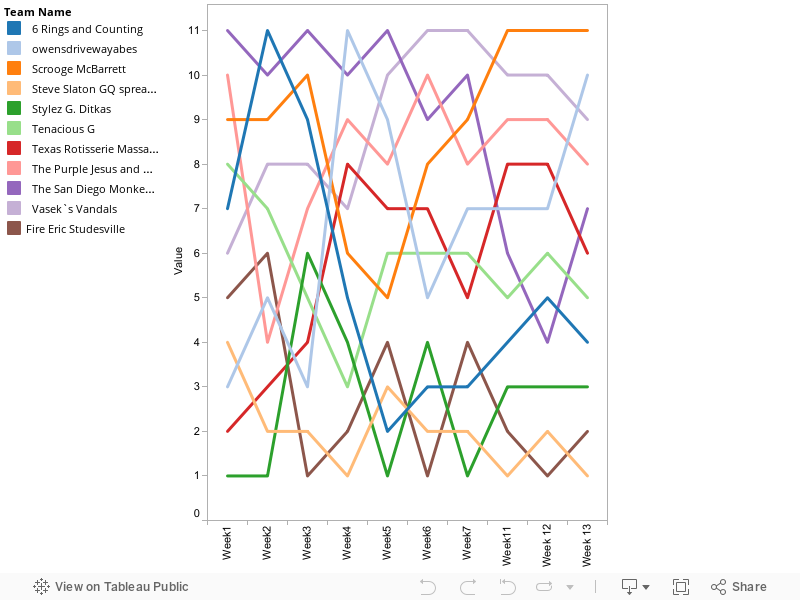
FF Standings
Here's a visualization of our league standings over the course of the year (minus the four weeks I forgot/gave up on my team). Some teams have fluctuated a lot over the year, while Catherine and I have been taking turns alternating our spot in the standings. I was doing this in Excel, wanted to see how it worked in Tableau, pretty easy to do.
Monday, December 13, 2010
NFL Fantasy Football League Standings
(Alternate title: Another Sports-Related Post That Will Only Interest the Authors of This Site. Enjoy!)
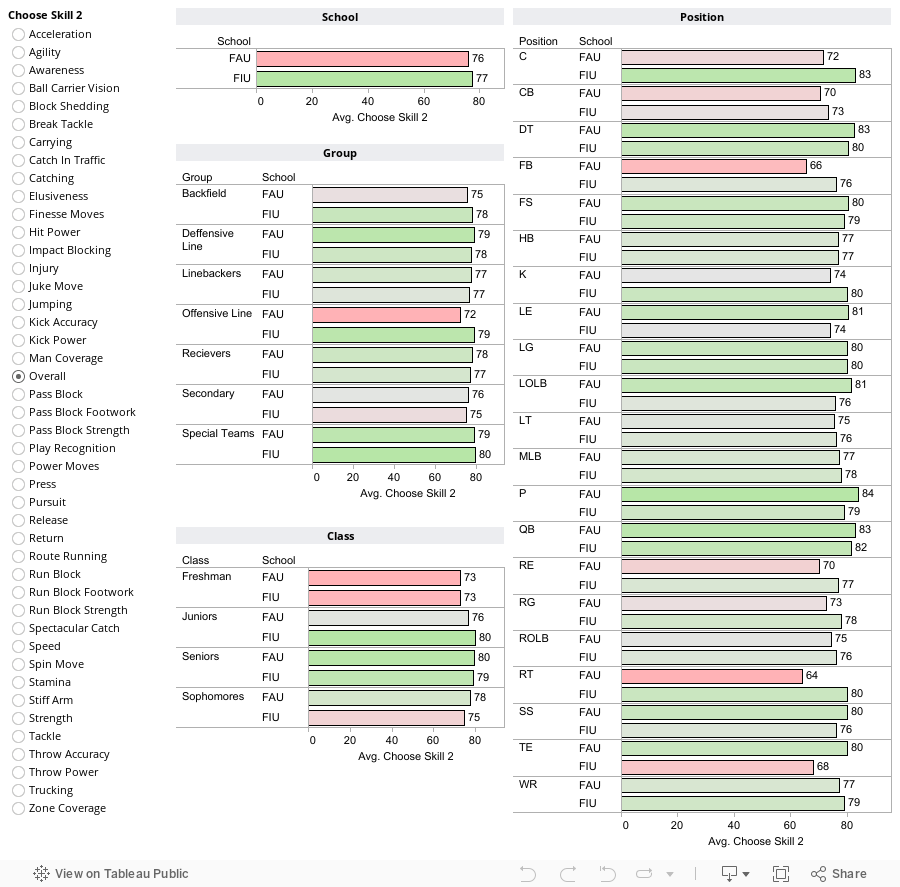
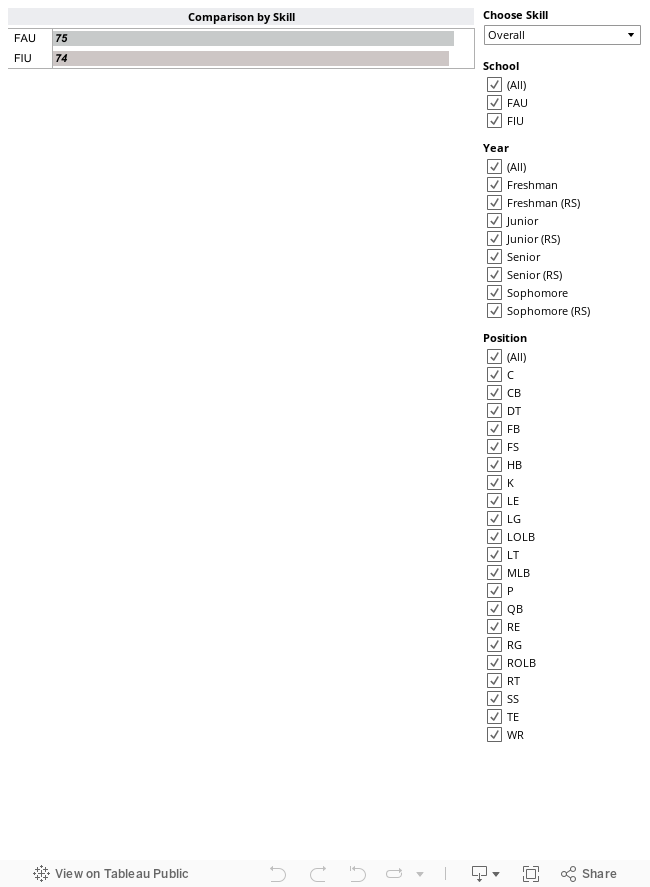
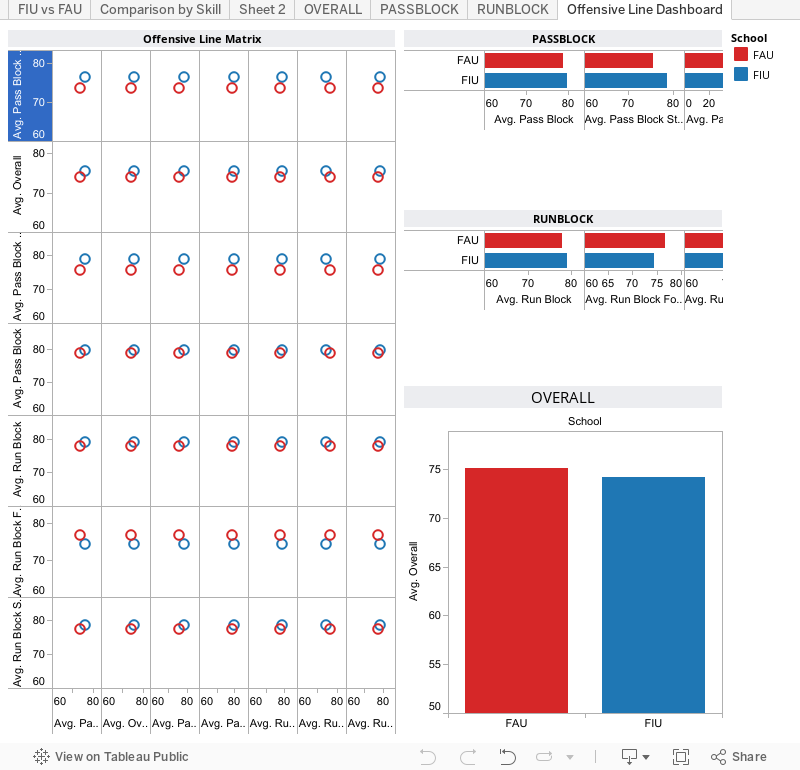
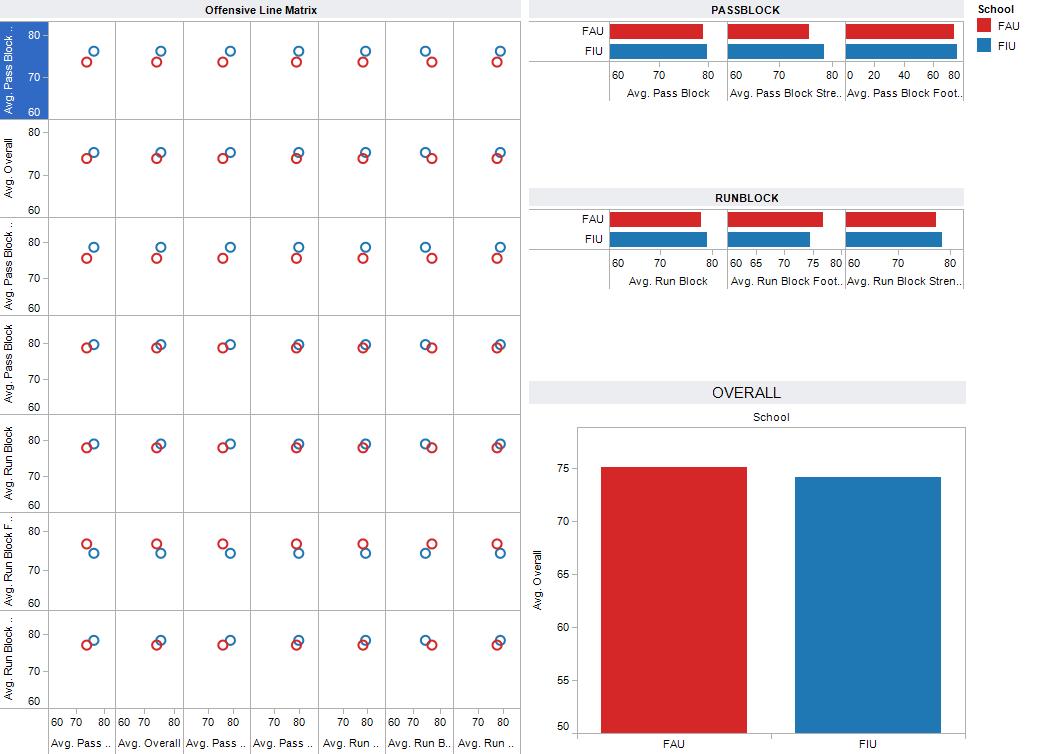
Welcome to any new readers, by the way! We're happy to have new eyes on our little site here, that was really built for a way for us to consolidate our geeky visualization e-mails into one place. Sometimes, our data is a little less-than-relevant to anyone outside of our random work conversations. (Like Mike's beautiful vizes of his PS3 NCAA league stats - in case you were wondering who FAU was and why they kept playing FIU ever week!)
Maybe we could be a little better at giving some background on the stats were presenting? Or maybe in our lack of narrative we're making a poignant observation on the ability of a visualization to transcend the need for wordy explanations. Or that with a great chart, one can understand a topic of which one has zero understanding. Or we're just being lazy :)
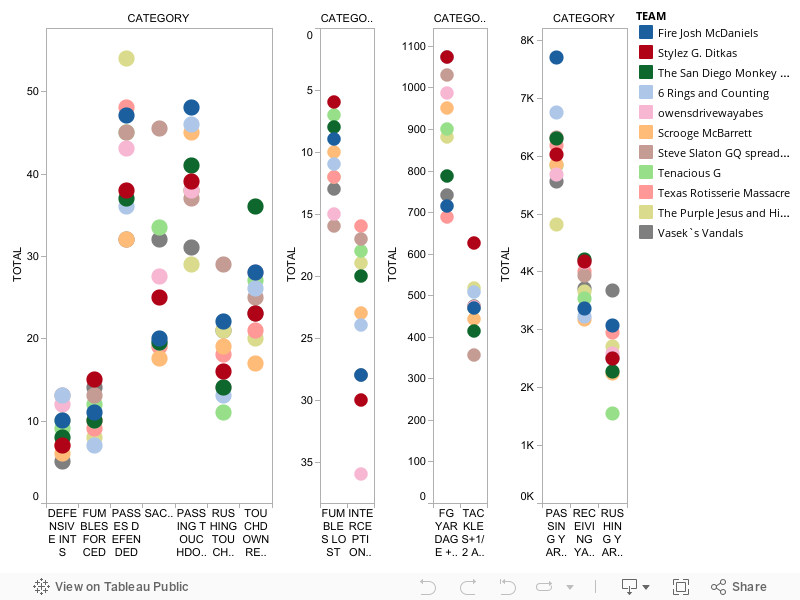
That being said, today's data is from yet another subject that no one outside of the three authors of this site will know much about. Our Fantasy Football League! (NFL, of course.) This is our stats-nerd league, which forgoes the typical points, head-to-head format of most leagues and instead goes directly to the stats the players are putting out. Understanding the statistical outliers that occur week to week in the real NFL, we make our scoring cumulative, rather than weekly - the final winner has earned the most points throughout the season.
So over our 11 scoring categories, our 18 starting players (10 offense, 8 defense) play, make stats, and those stats get credited to our individual teams. To weight each category fairly, if you are in 1st place in the category you get 11 points, last place gets 1, and these all get added together.
I modified this viz so our three teams have bold colors, to make it easier. Teams are:
Catherine: Stylez G Ditkas
Dan: Fire Josh McDaniels
Mike: The San Diego Monkey Brush
In the interest of this ongoing competition (which I REALLY want to win), I'm not going to talk too much about strategy - yet. But there are some categories I could easily move up in with minimal improvements in numbers. There are some I'm in a wholly comfortable position - even if that's at the bottom. (For example, Interceptions I am firmly in 2nd to last, and that's unlikely to change at any time. Thank you Mark Sanchez and Carson Palmer!)
These are the stats as of last week, so tomorrow we should have the new stats with updates from this weekend. Enjoy!
Welcome to any new readers, by the way! We're happy to have new eyes on our little site here, that was really built for a way for us to consolidate our geeky visualization e-mails into one place. Sometimes, our data is a little less-than-relevant to anyone outside of our random work conversations. (Like Mike's beautiful vizes of his PS3 NCAA league stats - in case you were wondering who FAU was and why they kept playing FIU ever week!)
Maybe we could be a little better at giving some background on the stats were presenting? Or maybe in our lack of narrative we're making a poignant observation on the ability of a visualization to transcend the need for wordy explanations. Or that with a great chart, one can understand a topic of which one has zero understanding. Or we're just being lazy :)
That being said, today's data is from yet another subject that no one outside of the three authors of this site will know much about. Our Fantasy Football League! (NFL, of course.) This is our stats-nerd league, which forgoes the typical points, head-to-head format of most leagues and instead goes directly to the stats the players are putting out. Understanding the statistical outliers that occur week to week in the real NFL, we make our scoring cumulative, rather than weekly - the final winner has earned the most points throughout the season.
So over our 11 scoring categories, our 18 starting players (10 offense, 8 defense) play, make stats, and those stats get credited to our individual teams. To weight each category fairly, if you are in 1st place in the category you get 11 points, last place gets 1, and these all get added together.
I modified this viz so our three teams have bold colors, to make it easier. Teams are:
Catherine: Stylez G Ditkas
Dan: Fire Josh McDaniels
Mike: The San Diego Monkey Brush
In the interest of this ongoing competition (which I REALLY want to win), I'm not going to talk too much about strategy - yet. But there are some categories I could easily move up in with minimal improvements in numbers. There are some I'm in a wholly comfortable position - even if that's at the bottom. (For example, Interceptions I am firmly in 2nd to last, and that's unlikely to change at any time. Thank you Mark Sanchez and Carson Palmer!)
These are the stats as of last week, so tomorrow we should have the new stats with updates from this weekend. Enjoy!
Sunday, December 12, 2010
Thursday, December 9, 2010
NBA Fantasy Pre-Season Projections - By Drafting Team
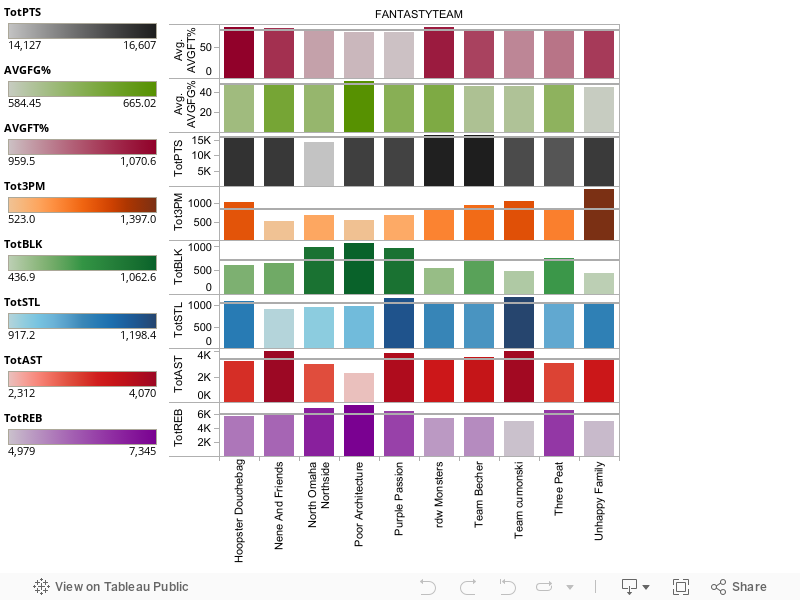
Not to overdo the visualizations (especially since I didn't translate superior data visualizations to a successful season so far...), but a little simpler, here's a team-by-team breakdown of the total projected points scored over the season, from all drafted players. (Is my average-in-most-categories a better strategy than the dominant-in-a-few-categories strategy of some other owners?)
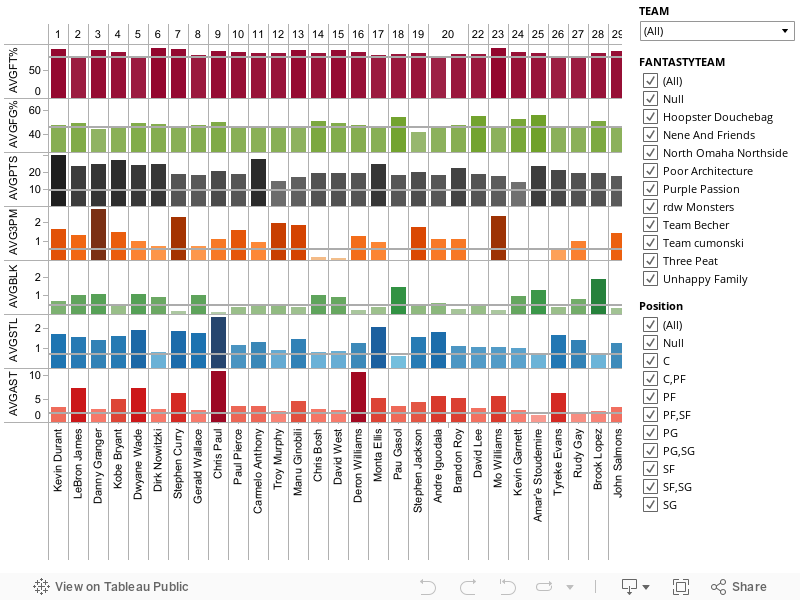
NBA Fantasy Pre-Season Projections - Top 200 Players
I'm in a Fantasy NBA league this year (team Hoopster Douchebags). Rules are, each week you play another team, there are 8 scoring categories, for each category you do better than the other guy, you get a point. I'm sure I could have explained that better.
So, I took the average projections for each of the 8 categories and used that to run my draft. After it was over, I plotted out all team selections by player in Tableau.
So, I took the average projections for each of the 8 categories and used that to run my draft. After it was over, I plotted out all team selections by player in Tableau.
Pareto Charts in Tableau!
http://www.thedatastudio.co.uk/blog/the-data-studio-blog/pareto-graphs-in-tableau
Wednesday, December 8, 2010
Tuesday, December 7, 2010
Tuesday, October 12, 2010
Fantasy Football Match-Up Visualization
I'm sure you've both seen this, but this is a really cool interactive visualization by CBS Fantasy Sports to help you select your fantasy team based on defensive match-ups. Maybe we should make one for setting your defense based on offensive performances!

Wednesday, October 6, 2010
NCAA Passing Efficiency Ratings
Nice article about how NCAA passing effiency ratings are calculated. They included the raw data since 1979, so I thought I'd plot it out in Tableau.
http://collegefootball.rivals.com/content.asp?CID=1135371

http://collegefootball.rivals.com/content.asp?CID=1135371
Wednesday, September 29, 2010

Wednesday, September 15, 2010
Yum - A Million Pieces of Pie!
A discussion with a coworker the other day centered around when a field has too many unique values to make it worthwhile for any data visualizations (as is, without any groupings). The answer we left with* was that when a pie chart's pieces blend into each other, it is definitely too many. So, data viz geek that I am, I had to draw it out for my own amusement:
 Oh wait, I can see where this might be confusing. Let me label it:

(Though is there an argument to be made that this pie chart may actually succeed in showing that pretty much every group is the same?)
*By the way, our answer was tentatively, 10-20 points**. But that's a topic for an entirely different post!
**Of course that doesn't mean 10-20 points on a pie cart....
 Oh wait, I can see where this might be confusing. Let me label it:
(Though is there an argument to be made that this pie chart may actually succeed in showing that pretty much every group is the same?)
*By the way, our answer was tentatively, 10-20 points**. But that's a topic for an entirely different post!
**Of course that doesn't mean 10-20 points on a pie cart....
Thursday, September 9, 2010
Global Warming Will Kill Us All!!!! or: Global Warming Will Killl Us All???
Looking at the hourly weather forecast tonight, I saw this terrifying graph:

Turns out, it was just the choice in y-axis values....

Turns out, it was just the choice in y-axis values....
Wednesday, September 8, 2010

Tuesday, September 7, 2010

Monday, August 9, 2010
Fantasy Football Visualization

Was working on this over the weekend, here is a visualization of QB passing yards by the ranking of their recieving corps, as rated by ESPN. While this data is highly inter-related (a good QB will likely have good recievers and vice versa), it's interesting to see the contrast between QB performance and the relative ratings of their wide receivers. Surprisingly, Brady has an average cast of recievers but had a lot of yards, not suprisingly Peyton Manning had a lot of yards and highly rated receivers. Oh yeah, and you probably want to avoid Orton and Josh Freeman this year. (or do you?) Wait why am I sharing this information with my competition? :)
Saturday, August 7, 2010
Millions and millions served by Tableau Public
Tableau Public’s score so far reads like one of those old McDonald’s marquees: 4.5 million people have visited data visualizations hosted by the site, says Tableau Software VP of marketing Elissa Fink.
More than 30,000 visualizations — “vizes” — have been published. The most popular of all, says Elissa, have been the ones about homes, personal budgets, and leisure. One of her own favorites is a local real estate blog, Seattle Bubble. “I wish I could have seen blogger Tim Ellis’s data in Tableau Public before I bought my house.”
Monday, July 19, 2010
sparklines
I decided to download the new Office 2010 over the weekend since we get a great employee discount on the software. I wanted to try out the new visualizations in Excel 2010 to see if there was as big an improvement from 2007 to 2010 as there was from 03 to 07. While the graphics look about the same across versions, I did notice they added sparklines to Excel 2010, so I decided to give them a try.
Below I loaded the number of wins by teams in the Big 12 for the last 3 years and then created a projected win total for this year based on those trends. I added 2 new sparklines to the table to visualize the data. While I doubt that Iowa State will have more wins than Oklahoma, it was pretty interesting to have a small visualization of how the teams have been doing over time and made it easier to understand the trends, which would be more useful if I had a bigger data set. I will continue to play around with the new visualization aspects and let you know what I find. I also downloaded PowerPivot and will see how that works with Excel 2010 as well.

Friday, July 9, 2010

Do You Like Forms?
This one looks like fun to fill out!! In honor of the Worst Web Design Ever post this week, the Worst Form Ever:
http://www1.iha.com/Vacation-rentals/B3/Search.htm
http://www1.iha.com/Vacation-rentals/B3/Search.htm
A Not-Totally-Unrelated Tie to Current Events!
In order to complete a full multi-channel, Web 2.0-ish discussion of the current Lebron James news* (also discussed over Twitter! Phone! IM! E-mail! Something called face-to-face discussion!), here is a fitting posting to add "Blogging!" to the list. LBJ popularity over his NBA career, as measured in totally fictional national opinion polls:

*Note that the news is he is a sniveling egomaniac who totally deserves all of the hate he's getting right now.... And this doesn't necessarily reflect the opinion of this site as a whole, but it should!

*Note that the news is he is a sniveling egomaniac who totally deserves all of the hate he's getting right now.... And this doesn't necessarily reflect the opinion of this site as a whole, but it should!
Thursday, July 8, 2010
Web Design Fail?
We don't talk much about web design as a whole. But this one's worth some kind of prize:
http://www.hosanna1.com/
I don't know if it's real, but it is fantastic!
http://www.hosanna1.com/
I don't know if it's real, but it is fantastic!
SPSS Viz Designer Is No Match For Tableau
SPSS recently released their new Viz Designer, a visualization engine built on Leland Wilkinson's work (The Grammar of Graphics and nViZn). The comparison with Tableau is unavoidable since both are based on the same underlying ideas. Right now, Viz Designer does not look good in that comparison.
In fact, it would be easy to slam the program. The user interface has a certain engineering look to it that reminds me of early GUI programs. There is also very little exploration and basically no interaction with the created graphics. There is also very little intelligence about the data, like detection of categorical vs. continuous dimensions. But then, the program is built on a very powerful basis and there is a large enough organization behind it to carry it over the first few, rough, releases. And there is also room for a different approach than Tableau, even though I think they're doing a lot of things right.
Thursday, July 1, 2010
Tuesday, June 1, 2010
What's Wrong With A Simple "BOING"?
From one of my new favorite blogs (creator of the Resort To Cannibalism Game, and the amazingly thought provoking Waiting For Bieber):

Interestingly, BOIOING was mentioned less often than both BOIOIOING and BOIOIOIOING. I'm not sure what that says about us as a society...
Interestingly, BOIOING was mentioned less often than both BOIOIOING and BOIOIOIOING. I'm not sure what that says about us as a society...
Friday, May 21, 2010
A Response to Stephen Few's "Douchebag" Detractor
We have made no secret about being fans of Stephen Few, linking to his blog and other work at least once a week.
Well a recent post by Few posted, in full, an argument made against his book by a claimed data visualization expert, Dennis Ross.
As fans of Few, of intellectual discussions about data visualization, and the importance of open opinions on these topics, we thought it was worth replying directly to Ross's points.
Ross's arguments against Few's book:
1. It's too academic.
Well the purpose is to put academic discussion behind visualization, and go beyond the "it's pretty!" analysis, right?
2. You can't tell clients they can't have what they want.
I don't think Few says that specifically, like, "I refuse to make a gauge". t's like survey, you give clients the best info you can, and then let them make their own decision. I totally disagree with just lying down and never giving a counter example. This was where the guy got insulting, and lost all credibility for me).
3. Bullet graphs suck, and are confusing to me.
In the right circumstance, they are good options. And just throwing out any chart form as too confusing is short-sighted, as there is almost always a perfect situation for any chart. Even a conical chart, always awful, could be useful to show how much of a cone has been constructed, right? And, if you only saw bullet graphs daily, they would make far more sense.
Perhaps I disagree with Few on the relative advantages and disadvantages of bullet graphs, pie charts, and bubble charts, though we all (I think) agree that it comes down to choosing the right graph for the data, and what you're trying to see.
4. Few's a douchebag because he hates Oracle/Xcelsius/etc.
Alongside this excellent point, some sub-arguments:
A. Tableau is ugly
So are you! See, I can make arguments that don't have reasoning too. And regardless of your opinion of the look of Tableau, it's more about the concept of visualizing complex multi-dimensional data. And visualizing it in a way that allows users to manipulate and adjust dynamically.
B. Oracle/Xcelsius are fine because they "can be improved, yes, but they are light years ahead of what we have been working with in the past 10 years."
Really? It's not OK to criticize because at least it's better than before? That's great. "Hey Iraqis, stop complaining, at least your government is better than it was 10 years ago!"
C. Oracle/Xcelsius "exist to serve customer or client needs, NOT Few’s design sensibilities."
Once again, this is the terrible POV that represents some of the worst areas of complacency in business. It is not an example of pig-headedness, or douchebaggery: it's actually a matter of personal responsibility. If I go into a restaurant and pick a sandwich off the menu that the server (a) thinks isn't very well made, (b) knows gets a lot of complaints, and (c) has a far superior, but similar, alternative in mind, she should tell me. In fact, the restaurant should probably stop including that sandwich on their menu in the first place.
But yes, if after all of that information is given, I still want my terrible sandwich, then the restaurant should probably make it for me.
(Speaking of, I have had several of my favorite meals taken off the menu of one of my favorite restaurants. I'm not sure what that says about me....)
**************************************************
As Few did in his posting, here are detractor Dennis Ross's sample dashboards.
Posted without comment.
We in this field of interest can freely disagree, but it is the arguments and defense that keep it strong. And it is only the strong arguments and defense which continue to advance the technologies we rely on (Tableau, Oracle, Xcelsius). Think of the amazing improvements between the oft-maligned default charting and color schemes of 2003 Excel, to the 2007 versions. And as people continue to discuss and debate Excel 2007's graphs, these will come in to making their future versions even better.
In short, by defining the entire visualization software discussions and debate as unnecessary, and those that ask for better as "douchebags", you are doing a great disservice.
**************************************************
This was a fantastic end quote from Few which I will undoubtedly use again:
"Keep giving your customers what they want, even when it doesn’t work, rather than taking responsibility as a consultant to add value. That may satisfy them for the moment, but it won’t help them in the least."

Thursday, May 20, 2010
Wednesday, May 19, 2010
The Old Days of Web Design
Remember Geocities? Every other page had one of those running dogs, or the blinking Under Construction site, or similar? Well, now you don't have to!
In fact, I encourage you now to reload this blog in what is, inarguably, a better format. Here you go!
As the Onion AVClub would say, "Great job, internet!"
In fact, I encourage you now to reload this blog in what is, inarguably, a better format. Here you go!
As the Onion AVClub would say, "Great job, internet!"
Tuesday, May 18, 2010
Dashboard Critique - Part Two
Work has finally died down enough to continue with the Dashboard Critique series that was started in Part One. If you remember, we were looking at this post from Dan, showing a company's Flash-based dashboard product.
In Part One, I talked about the left side of the dashboard, from the teeny-tiny column charts, to the mastery of white space misuse that was the Traffic Light "chart".
In this next part, I'm going to discuss the upper right corner of the dashboard. They're a little more boring in the scheme of things, but that just sets us up for the pure excitement of Part Three (tentative title: What is the most misleading chart ever, the cone chart or the 3-D ring?).
So here we go!
**********************************************************
The first chart is this yawn-inducing spreadsheet on the top middle:

Now, this is an interesting case, because I'm not one to say that EVERYTHING must be in graphs and charts. This is definitely the best way to show this detail, which is probably on the dashboard because it's very important to this theoretical client. Let's assume this, for sake of argument!
Let's also cover the other good things. I like the immediate red visualization for high risk. I like that some of the entries seem to be links (again assuming they are links, and not just text with underlined font). It appears I can filter. The rows are colored gray/white, making them easy to follow.Now, the bad. In the spirit of this non-visualization, I'll do it in list form:
If you look worse than what comes in default Microsoft Office settings, you have a problem.
I'm going to get that embroidered on a pillow.
**********************************************************
OK, this next one's gonna be easy. This is arguably the biggest visual punch of the dashboard, so it must be great, right? On the upper right corner:
 It took me a while to figure out what this graph was trying to show us. I get it now - the "general budget trend" is at -$37,000 (uh oh!), and if negative it's in the red, and positive in the green. Simple. One number, is it positive or negative.
So why is it so big???
And, if it's so big, why is the Main Point Of All This, the where you are now (-$37,000), so small?
There's not much to say that isn't terribly obvious here. I'm guessing the makers of this demo dashboard figured they needed a non-gauge gauge here. But this is basically a horizontal gauge. Not that there's anything wrong with that! It's just so poorly executed in this case....
Now in Part 3, we will be talking about the gauge on this dashboard, so they'll be plenty of time for that. My main problem with gauges is that they show so little for so much space. Though this graph sure proves that it can be worse!
Now, there's something to be said for a non-circular display (an issue with gauges), especially for postive/negative financials. And the real estate this should take up is relatively small, compared to a gauge. So if they had slimmed down the height of this bar, and put about 3 or 4 in this module (say, last month's average, last year's average, etc. - whatever's important.)
Part Three's discussion of gauge's sure will be fun!
**********************************************************
Moving on to, unfortunately, another yawner. This non-chart:

I've gotta say, this was another one that made me scratch my head as I tried to figure it out. And let me say, I still have absolutely no idea. Seriously. If you know what this is showing, let me know in the comments!
I'll tell you what it looks like went wrong here. The legend was so big, and the labels were so long (and shifted 180 degrees didn't give much room there), and the title, "Value of 0 = project on target", so long, that the actual visualization got smooshed and smooshed down into a tiny little space. I believe that might be a line chart, or perhaps an area chart? That's my best guess.
But wow, did this one screw up. (Remember, we got this out of marketing material for a data visualization company, believe it or not.)
Fix it. Change the legend to be in a box on the side, or remove it all together (have a button that will bring it up, add labels to the chart, add mouse-over tool tip info about what you're looking at - these are all non-default options that would be better. Just fix it, move things around, until you can actually see the data! Take the labels out of 180 degrees, and flip them to normal.
Oh, and those colors all look alike in the legend. You can't do that. Even if we could see the graph itself, this sure wouldn't be useful in any way.
**********************************************************
I think what has surprised me in this world of dashboards, having been working with data visualization as much as I have as an analyst, is how much people take the default that's given to them. If you wouldn't put it in a presentation, then it shouldn't go in a dashboard. You should be able to fix size, colors, text, font, etc. in a dashboard as much as you can in standard-issue Excel.
Remember:
I'll send pictures of my embroidered pillow when it's done.
Part Three, coming soon!
In Part One, I talked about the left side of the dashboard, from the teeny-tiny column charts, to the mastery of white space misuse that was the Traffic Light "chart".
In this next part, I'm going to discuss the upper right corner of the dashboard. They're a little more boring in the scheme of things, but that just sets us up for the pure excitement of Part Three (tentative title: What is the most misleading chart ever, the cone chart or the 3-D ring?).
So here we go!
**********************************************************
The first chart is this yawn-inducing spreadsheet on the top middle:

Now, this is an interesting case, because I'm not one to say that EVERYTHING must be in graphs and charts. This is definitely the best way to show this detail, which is probably on the dashboard because it's very important to this theoretical client. Let's assume this, for sake of argument!
Let's also cover the other good things. I like the immediate red visualization for high risk. I like that some of the entries seem to be links (again assuming they are links, and not just text with underlined font). It appears I can filter. The rows are colored gray/white, making them easy to follow.Now, the bad. In the spirit of this non-visualization, I'll do it in list form:
- The biggest issue - that tiny horizontal scroll bar. I think if I scrolled to all the way to the right, that 5% extra space would show the rest of the Response column. They should have tried to fit it all in one horizontal view, which seems possible with the current choices. Having both horizontal and vertical scroll bars is a pretty big no-no.
- Part of #1's issue is that maybe this is just too small a space for so much information. Twice the width would pretty much solve your issue, and make this readable. And allow some of the other issues I'll go into in the next points to be solved.
- I need a chart like this to see a lot of different things at once. This also applies vertically. That text wrapping is making every row super-wide, so I can only see 2 of 46 in this view. Take out text wrapping that interferes. You can substitute the text wrapping by letting me mouse over and see the full text, for example. And/or allow me to click to pull the entire chart into a pop-up window. You have to think smarter than default.
- We all work with spreadsheets and charts all the time nowadays. I need to be able to sort and filter by column headers.
- Speaking of, either give me good, sensical column sizes, or allow me to change the sizes myself. (Though please save my settings if that's the case...) Why is the Milestone column width the same as the Issue column width?
- Though charts don't need borders around every cell, this needs something more than what they have. Very narrow and light vertical column separation, for example. Or better control of the internal margins of the cells (you can change the default settings, you know...). Or use more horizontal centering of cell content that isn't a long sentence. Something. That Action column's text is practically covering up the Response column!
If you look worse than what comes in default Microsoft Office settings, you have a problem.
BE SMARTER THAN DEFAULT
I'm going to get that embroidered on a pillow.
**********************************************************
OK, this next one's gonna be easy. This is arguably the biggest visual punch of the dashboard, so it must be great, right? On the upper right corner:
 It took me a while to figure out what this graph was trying to show us. I get it now - the "general budget trend" is at -$37,000 (uh oh!), and if negative it's in the red, and positive in the green. Simple. One number, is it positive or negative.
So why is it so big???
And, if it's so big, why is the Main Point Of All This, the where you are now (-$37,000), so small?
There's not much to say that isn't terribly obvious here. I'm guessing the makers of this demo dashboard figured they needed a non-gauge gauge here. But this is basically a horizontal gauge. Not that there's anything wrong with that! It's just so poorly executed in this case....
Now in Part 3, we will be talking about the gauge on this dashboard, so they'll be plenty of time for that. My main problem with gauges is that they show so little for so much space. Though this graph sure proves that it can be worse!
Now, there's something to be said for a non-circular display (an issue with gauges), especially for postive/negative financials. And the real estate this should take up is relatively small, compared to a gauge. So if they had slimmed down the height of this bar, and put about 3 or 4 in this module (say, last month's average, last year's average, etc. - whatever's important.)
Part Three's discussion of gauge's sure will be fun!
**********************************************************
Moving on to, unfortunately, another yawner. This non-chart:

I've gotta say, this was another one that made me scratch my head as I tried to figure it out. And let me say, I still have absolutely no idea. Seriously. If you know what this is showing, let me know in the comments!
I'll tell you what it looks like went wrong here. The legend was so big, and the labels were so long (and shifted 180 degrees didn't give much room there), and the title, "Value of 0 = project on target", so long, that the actual visualization got smooshed and smooshed down into a tiny little space. I believe that might be a line chart, or perhaps an area chart? That's my best guess.
But wow, did this one screw up. (Remember, we got this out of marketing material for a data visualization company, believe it or not.)
Fix it. Change the legend to be in a box on the side, or remove it all together (have a button that will bring it up, add labels to the chart, add mouse-over tool tip info about what you're looking at - these are all non-default options that would be better. Just fix it, move things around, until you can actually see the data! Take the labels out of 180 degrees, and flip them to normal.
Oh, and those colors all look alike in the legend. You can't do that. Even if we could see the graph itself, this sure wouldn't be useful in any way.
**********************************************************
I think what has surprised me in this world of dashboards, having been working with data visualization as much as I have as an analyst, is how much people take the default that's given to them. If you wouldn't put it in a presentation, then it shouldn't go in a dashboard. You should be able to fix size, colors, text, font, etc. in a dashboard as much as you can in standard-issue Excel.
Remember:
BE SMARTER THAN DEFAULT
I'll send pictures of my embroidered pillow when it's done.
Part Three, coming soon!
Sunday, May 9, 2010
Big BI
"no interface, no matter how magical, will give you access to data that isn’t available, will clean data that is dirty, or will simplify the navigation of complicated operational databases." - Stephen Few
Friday, May 7, 2010
Monday, May 3, 2010
Bad Use of Pie Charts
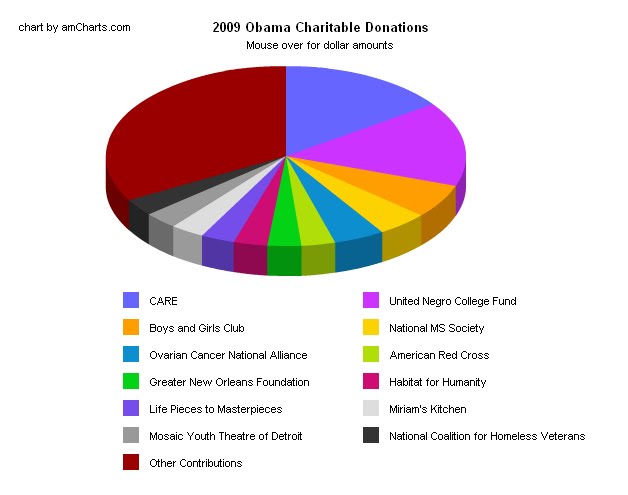
While we all agree that pie charts can be useful, I noticed on AOL's "The Grid-News by the Numbers", a pie chart breaking down Obama's charitable donations. There were 13 slices of the pie, which made it too much cognitive work to match the colors to the slices, not to mention trying to decipher the differences between a slice that represents 3.04% of the whole and a slice that represents 4.0%. I think a bar chart would have been much more visually effective.
http://www.aolnews.com/the-grid/article/tax-return-shows-obama-familys-favorite-charities/19443320
Saturday, April 17, 2010

Wednesday, April 14, 2010
New Stephen Few blog post
Here is a great new blog post by Stephen Few talking about how to make the right decisions creating data visualizations rather than letting software make the decisions for us. He even references our patron saint, William Playfair!
Monday, April 12, 2010
Hey, This Chart Isn't Mathematically Accurate!
I made a quick purchase on a site today, and got one of those Bizrate.com survey requests. One of those, "Take this survey, you might win $25" offers (and I like free money).
After taking the 3-question survey, I got this summary of my responses. This is the actual screenshot of how my scores measured. Take a good look, and you might see what is wrong:
 But at least I might win $25!
By the way, I'm also surprised a 7/10 got a satisfaction rating on the scientific smiley-face scale of
:)
Unless a 10/10 is a
:D
In which case, it's accurate!
Friday, April 9, 2010
Wednesday, April 7, 2010
Walmart Growth in Flash Data Visualization!
This is great:
Walmart growth since the 1970's
And how he did it!
We're all fans of mapping by zip code (and Tableau, one of our favorite data visualization tools, has that built in). Animating in Flash might not be possible right now. But a year-to-year view of something similar? I think that's a challenge one of us running this blog should tackle!!
Friday, April 2, 2010
Blog post about Stephen Few's blog
Here's a recent entry related to dashboard design on Stephen Few's blog:
Thursday, April 1, 2010
Dashboard Critique - Part One
Dan recently put up this post, from a company's Flash-based dashboard product. Take a minute if you haven't already at the visuals:
http://playfairgroup.blogspot.com/2010/04/i-recently-got-e-mail-for-flash-based.html
I started to dissect the issues in the comments, but realized this probably needed its own entry. And once I started going, I realized this might need several entries!
I hate to tear apart others' visualizations, but it is hard to look beyond the poor choices made in this dashboard - both in chart type and formatting. And it's not necessarily this company who is alone in making these types of mistakes. It seems to be a common issue in these one-size-fits-all template dashboards, where you may be able to throw a chart here or there, though the thought seems to be missing for what you should see, and how you should see it. And of course, the formatting. Egads, the formatting. But more on that as we go on.
So here we go....
**********************************************************
Let's start up on the upper left and lower left charts, the two column charts of this dashboard:
 Not knowing much about this data, it seems that the choice of a column chart here was spot-on. When you are looking to compare different aspects of like groups (here Budget/Actual/Anticipated, and Actual/Anticipated, of these business segments). What ruins these? Mostly, the size of the chart itself. I don't think there should ever be a reason to have more than 50% of the space in your chart display be for data labeling - and this must be at least 80%. With South Dashboards, is Anticipated higher than Budget? Is the actual percent complete of North Dashboards higher or lower than anticipated? I think once they see the y-axis labels running into each other like this, it's time to stretch things out.
Fixes? Either shrink the size of the text (make 2 lines, or abbrev. depts.), or increase the size of the graph's space. You know, Excel chart manipulation 101.
(There also may be too much rounding of the column edges to make accurate readings, but I can't tell for sure within the half inch of space provided...)
**********************************************************
Let's finish off the left side with arguably the most obvious waste-of-space on this dashboard, the traffic light:

The purpose of this chart is understood - it is trying to communicate a simple point: this project is behind schedule. But even a gauge chart (which I will get to later) give more meaning, since you can at least judge how far you are behind a target. The sad, lonely "-13%" floating at the bottom of the graphic makes me yearn for so much more. Oh what a useful chart you could have been!
Now, I am a fan of traffic lights in data visualization. Their colors are universally meaningful - RED=BAD/STOP, YELLOW=OK/CAREFUL, GREEN=GOOD/GO! In fact, the colors are so meaningful on their own, that you really don't have to build a physical traffic light diagram on which to display them.
Not to mention, of course, it takes up such valuable real estate on this dashboard with an essentially meaningless image. (The waste of space is particularly sad given the content both above and below so desparately needing more room.)
So ignoring the possibility of charting the percentages, and simply using the traffic light approach, here is an example of how to make this a more efficient use of space, and how to show, generally, how to use the traffic light concept to track projects. (Which the title of this module, "General Project Trend", has me believe is the point.)
 Yes, a bad mock-up using MS Paint, but you get the idea. Some projects are in danger, some are close, and others are on the right track. Quick. Easy.
**********************************************************
So that about covers the left side of the dashboard. Coming up new posts, I will dissect the other areas of the dashboard, and look at the build as a whole.
I recently got an e-mail for a flash-based dashboard company with a link to their demo. (See screen shot below). How much of this is useful information and how much of the dashboard is wasted on chart junk? Seems like this space could be used a lot more effectively, but is this what people are asking for on their dashboards?

Wednesday, March 31, 2010
Words of Wisdom from Coco's Twitter Page
Social media research doesn't work for every brand. Even if you really want it to.
Tuesday, March 30, 2010

Monday, March 29, 2010

The Final Word on Pie Charts

Could you create a histogram of your favorite pareto charts; and a pareto chart of your favorite histograms? I think not!
(Thank you, "How I Met Your Mother"!)
Pie Chart Defense!
In the world of statistics and data visualization, you often find a backlash against the simple pie chart. Here at the playfairgroup, this discussion comes up quite a bit. Our point of view? The pie chart can be great when it is exactly that - SIMPLE.
Mike's story:
Mike's story:
So I was chatting with a friend of mine on Skype last night and I was
going into some detail about my affinity for pie charts.
He simply responded:
"Pareto and histogram. Everything else is bullshit"
Dan's visual response:
Can’t put a histogram on a map! (at least not in Tableau)

Catherine's response:
First, histograms are only good for certain situations (a lot of data points, when you are trying to see the overall distribution, etc.). But, since they data is put into categories, it is easily manipulated based on what categories you pick (like ignoring the differences between months when grouping data into a full year). Pareto charts have a lot of the same problems.
Is your friend in QA? He's probably following the 7 useful charts that exist according to QA Wikipedia:
http://en.wikipedia.org/wiki/Seven_Basic_Tools_of_Quality
As I've said before, pie charts are very effective for certain situations. It's for a general estimate of ratios, not exact percentages (that's why I always label them!). I usually only like a few slices max, because it starts to get misleading if you are looking at similarly sized pieces (since it's not obvious which is bigger). But showing that this group is 10% of the whole, this other group is 20% of the whole, and 70% other? Well that's what a pie chart is made for!!Tell your friend to put THAT in a histogram!!!!!
And, with final thoughts, Dan:
Here's a couple articles in defense of pie charts if you ever need ammo to support your love of pie charts:
“I don't accept the information design dogma that pie charts should never be used. Pie charts have weaknesses but they also have many strengths. Put them back in your bag of tools and pull them out when appropriate.”
http://www.neoformix.com/2007/InDefenseOfPieCharts.html
http://www.arcadejournal.com/public/IssueArticle.aspx?Volume=27&Issue=3&Article=311
Sunday, March 28, 2010

Saturday, March 27, 2010
Old Tableau blog post on building a word cloud with Tableau
http://www.tableausoftware.com/blog/text-analysis-election08-stump-speeches
http://www.tableausoftware.com/files/major-candidates-speech-comparisons.twbx
Text Analysis on Election '08 stump speeches
by Raif Majeed on February 4, 2008 - 2 comments
If you've seen the news, you'll know that there are lots of words flying around nowadays -- political speeches, debates, ads, etc. If you're trying to understand the words and decide how to vote, it can be overwhelming. However, if you look at the words as data, you can suddenly get interesting new insights.
Here's an interesting packaged workbook that shows a text analysis of recent stump speeches by the four major remaining presidential candidates (Hillary Clinton, John McCain, Barack Obama, and Mitt Romney). To give you a flavor of the kind of analysis I've done here, I've developed a packaged workbook showing the most common 2-word phrases uttered in each candidate's speech:
You can adjust the quick filter under the dashboard to limit yourself to phrases of a certain length of characters (the space between the words counts as one character). I want to keep this post politically neutral, so I'll let you dig in with Tableau (or the free Tableau Reader) and make your own discoveries. I'm sure you'll be surprised by some of the results, as I was.
The speeches were pulled from candidate websites; each was in a different forum -- for instance, Hillary Clinton was speaking in a church and Mitt Romney was speaking to auto workers in Michigan, which accounts for some of the unusual phrases you see.
To get the texts into a form that Tableau could understand, I used a quick Perl script to eliminate non-word characters (except whitespace, apostrophes, and hyphens), then split the text on whitespace and output the result as a CSV. To get 2-word analysis, I left-joined the resulting CSV against itself, with a one-off ON condition ("[current].[Position]+1=[next].[Position]", where [current] and [next] are table aliases). I used context filters and dashboards liberally to generate what you see.
I encourage you to play around with the workbook in Tableau and see what patterns you can find. Enjoy!
Subscribe to:
Posts (Atom)