Tuesday, December 28, 2010
Thursday, December 23, 2010
The Use of Colors on Business Dashboards

Tuesday, December 14, 2010
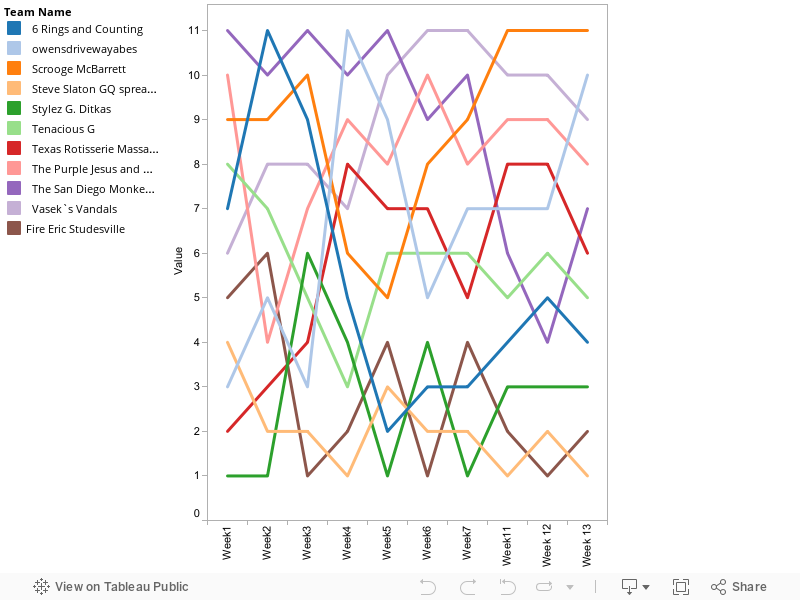
FF Standings
Here's a visualization of our league standings over the course of the year (minus the four weeks I forgot/gave up on my team). Some teams have fluctuated a lot over the year, while Catherine and I have been taking turns alternating our spot in the standings. I was doing this in Excel, wanted to see how it worked in Tableau, pretty easy to do.
Monday, December 13, 2010
NFL Fantasy Football League Standings
(Alternate title: Another Sports-Related Post That Will Only Interest the Authors of This Site. Enjoy!)
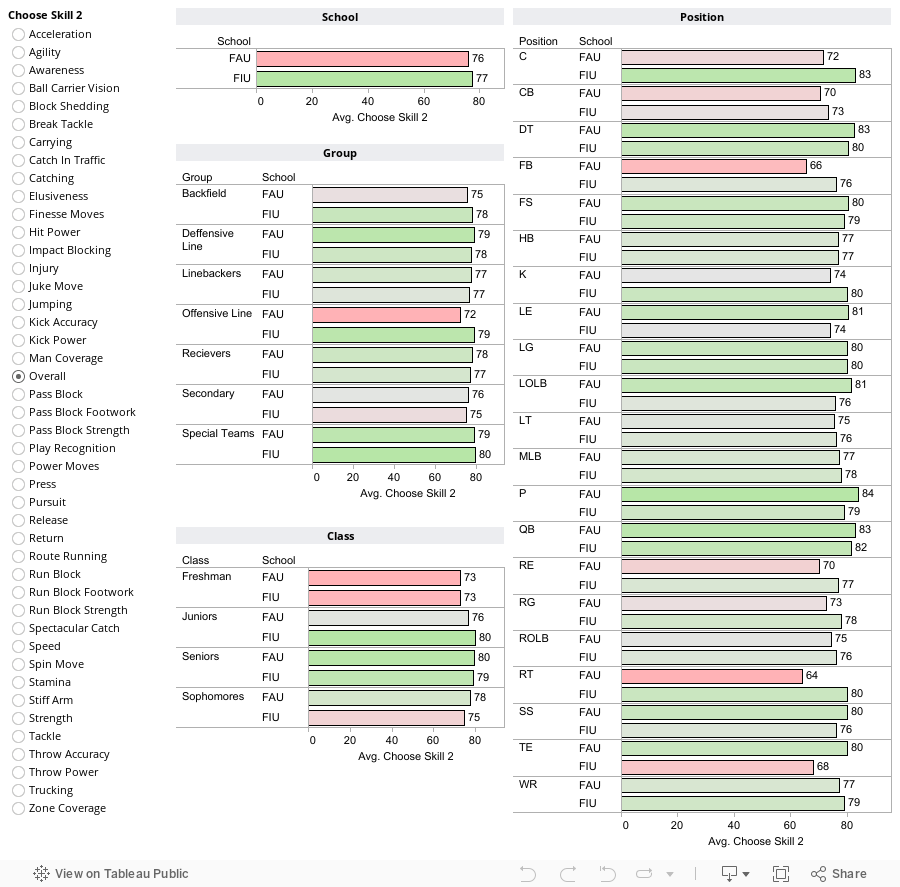
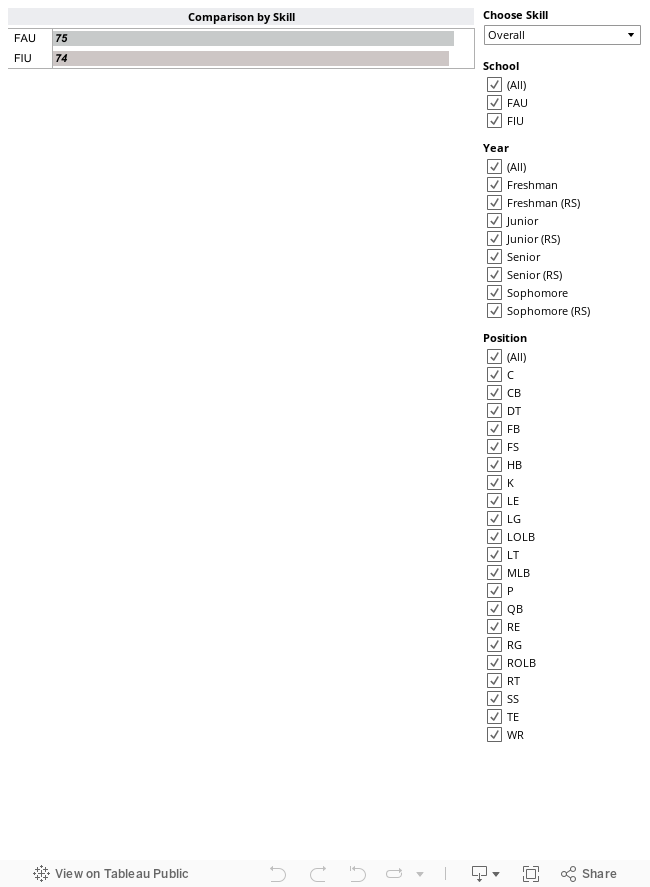
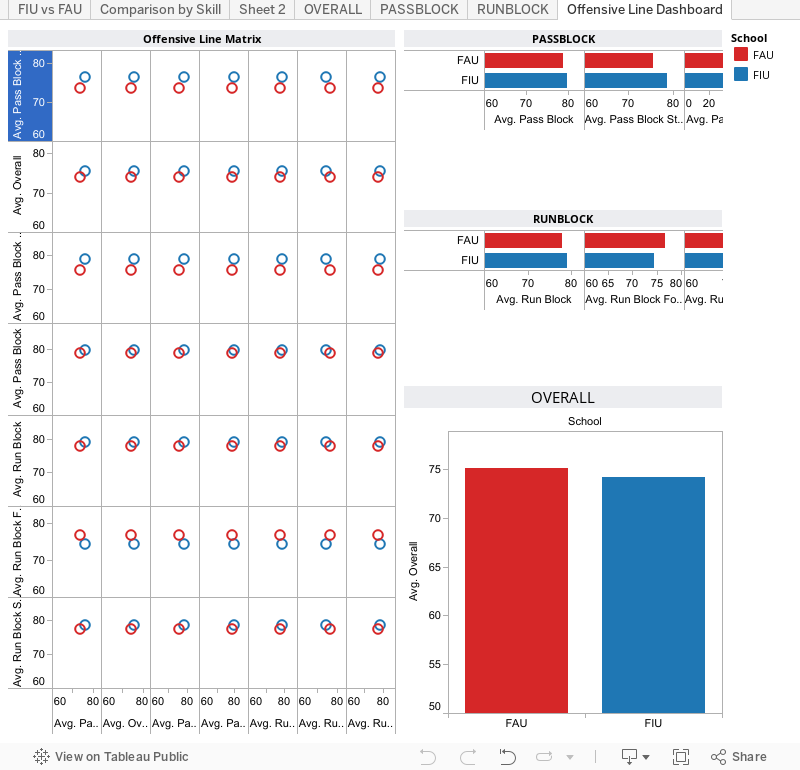
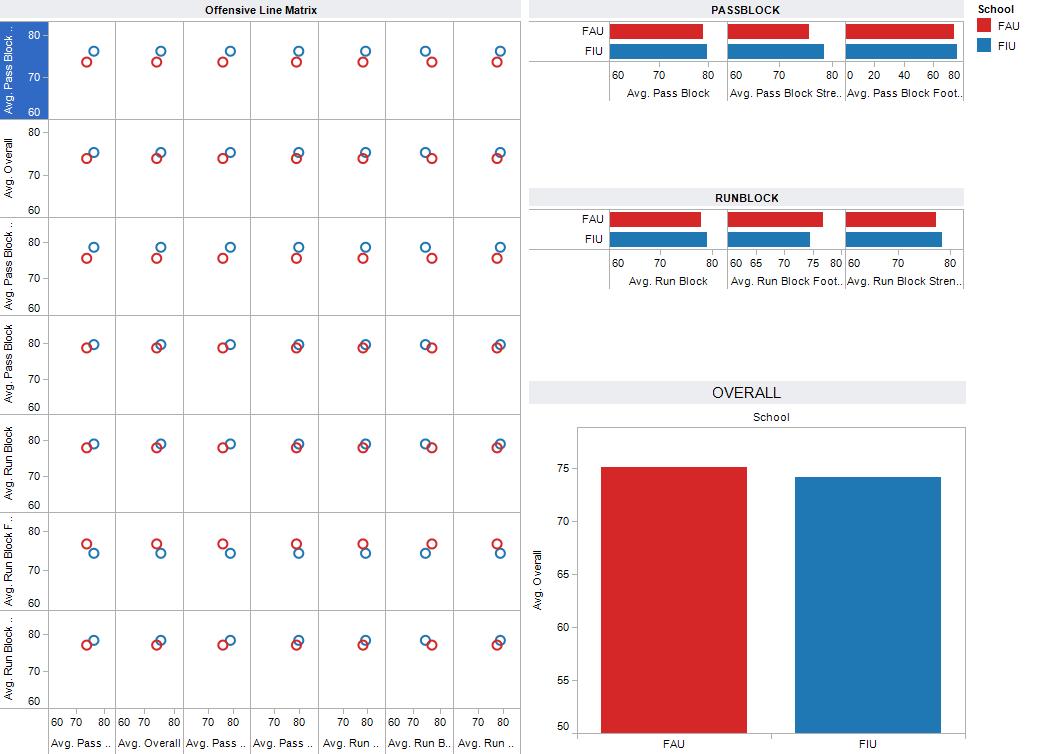
Welcome to any new readers, by the way! We're happy to have new eyes on our little site here, that was really built for a way for us to consolidate our geeky visualization e-mails into one place. Sometimes, our data is a little less-than-relevant to anyone outside of our random work conversations. (Like Mike's beautiful vizes of his PS3 NCAA league stats - in case you were wondering who FAU was and why they kept playing FIU ever week!)
Maybe we could be a little better at giving some background on the stats were presenting? Or maybe in our lack of narrative we're making a poignant observation on the ability of a visualization to transcend the need for wordy explanations. Or that with a great chart, one can understand a topic of which one has zero understanding. Or we're just being lazy :)
That being said, today's data is from yet another subject that no one outside of the three authors of this site will know much about. Our Fantasy Football League! (NFL, of course.) This is our stats-nerd league, which forgoes the typical points, head-to-head format of most leagues and instead goes directly to the stats the players are putting out. Understanding the statistical outliers that occur week to week in the real NFL, we make our scoring cumulative, rather than weekly - the final winner has earned the most points throughout the season.
So over our 11 scoring categories, our 18 starting players (10 offense, 8 defense) play, make stats, and those stats get credited to our individual teams. To weight each category fairly, if you are in 1st place in the category you get 11 points, last place gets 1, and these all get added together.
I modified this viz so our three teams have bold colors, to make it easier. Teams are:
Catherine: Stylez G Ditkas
Dan: Fire Josh McDaniels
Mike: The San Diego Monkey Brush
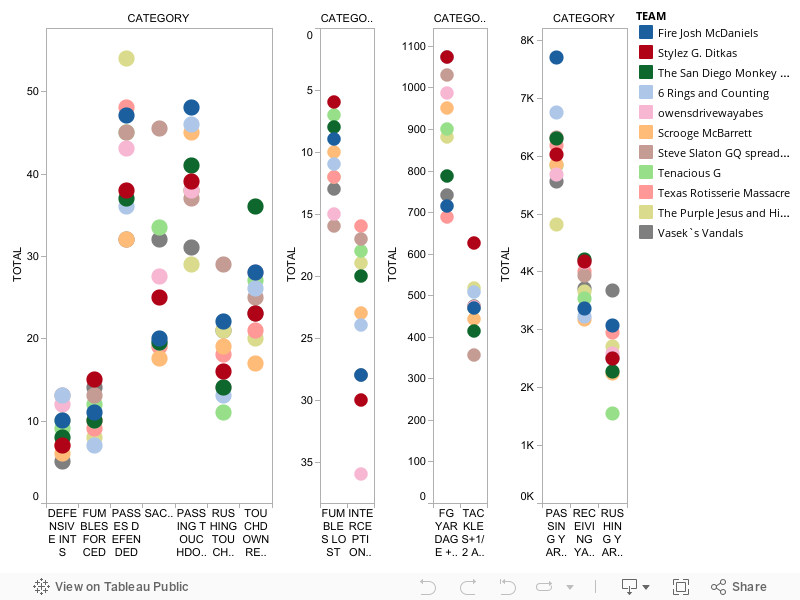
In the interest of this ongoing competition (which I REALLY want to win), I'm not going to talk too much about strategy - yet. But there are some categories I could easily move up in with minimal improvements in numbers. There are some I'm in a wholly comfortable position - even if that's at the bottom. (For example, Interceptions I am firmly in 2nd to last, and that's unlikely to change at any time. Thank you Mark Sanchez and Carson Palmer!)
These are the stats as of last week, so tomorrow we should have the new stats with updates from this weekend. Enjoy!
Welcome to any new readers, by the way! We're happy to have new eyes on our little site here, that was really built for a way for us to consolidate our geeky visualization e-mails into one place. Sometimes, our data is a little less-than-relevant to anyone outside of our random work conversations. (Like Mike's beautiful vizes of his PS3 NCAA league stats - in case you were wondering who FAU was and why they kept playing FIU ever week!)
Maybe we could be a little better at giving some background on the stats were presenting? Or maybe in our lack of narrative we're making a poignant observation on the ability of a visualization to transcend the need for wordy explanations. Or that with a great chart, one can understand a topic of which one has zero understanding. Or we're just being lazy :)
That being said, today's data is from yet another subject that no one outside of the three authors of this site will know much about. Our Fantasy Football League! (NFL, of course.) This is our stats-nerd league, which forgoes the typical points, head-to-head format of most leagues and instead goes directly to the stats the players are putting out. Understanding the statistical outliers that occur week to week in the real NFL, we make our scoring cumulative, rather than weekly - the final winner has earned the most points throughout the season.
So over our 11 scoring categories, our 18 starting players (10 offense, 8 defense) play, make stats, and those stats get credited to our individual teams. To weight each category fairly, if you are in 1st place in the category you get 11 points, last place gets 1, and these all get added together.
I modified this viz so our three teams have bold colors, to make it easier. Teams are:
Catherine: Stylez G Ditkas
Dan: Fire Josh McDaniels
Mike: The San Diego Monkey Brush
In the interest of this ongoing competition (which I REALLY want to win), I'm not going to talk too much about strategy - yet. But there are some categories I could easily move up in with minimal improvements in numbers. There are some I'm in a wholly comfortable position - even if that's at the bottom. (For example, Interceptions I am firmly in 2nd to last, and that's unlikely to change at any time. Thank you Mark Sanchez and Carson Palmer!)
These are the stats as of last week, so tomorrow we should have the new stats with updates from this weekend. Enjoy!
Sunday, December 12, 2010
Thursday, December 9, 2010
NBA Fantasy Pre-Season Projections - By Drafting Team
Not to overdo the visualizations (especially since I didn't translate superior data visualizations to a successful season so far...), but a little simpler, here's a team-by-team breakdown of the total projected points scored over the season, from all drafted players. (Is my average-in-most-categories a better strategy than the dominant-in-a-few-categories strategy of some other owners?)
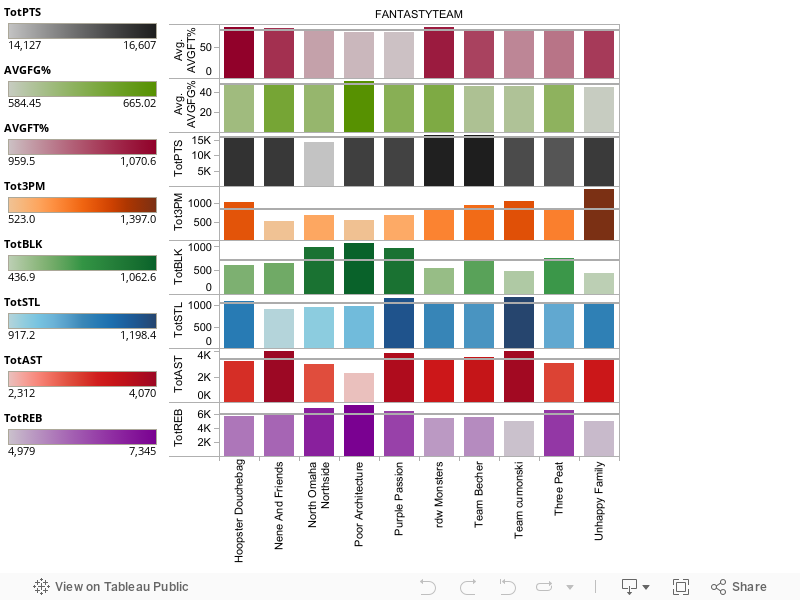
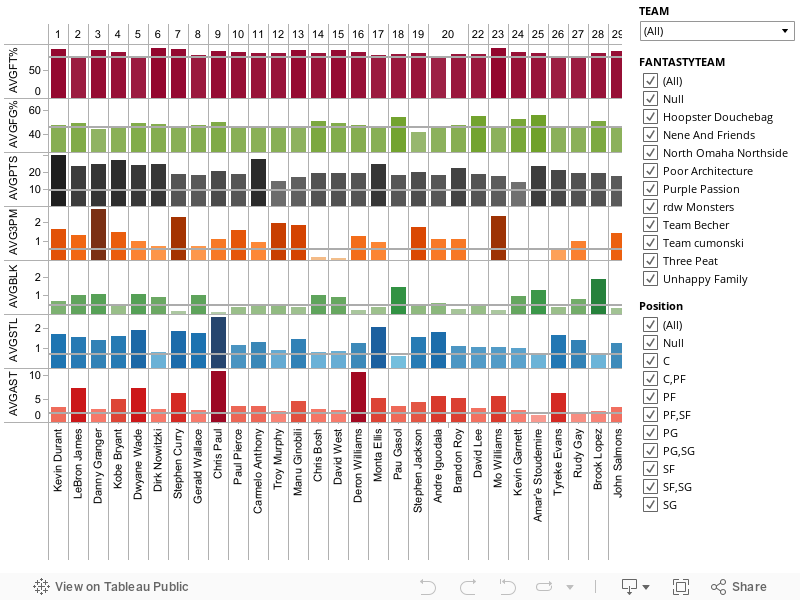
NBA Fantasy Pre-Season Projections - Top 200 Players
I'm in a Fantasy NBA league this year (team Hoopster Douchebags). Rules are, each week you play another team, there are 8 scoring categories, for each category you do better than the other guy, you get a point. I'm sure I could have explained that better.
So, I took the average projections for each of the 8 categories and used that to run my draft. After it was over, I plotted out all team selections by player in Tableau.
So, I took the average projections for each of the 8 categories and used that to run my draft. After it was over, I plotted out all team selections by player in Tableau.
Pareto Charts in Tableau!
http://www.thedatastudio.co.uk/blog/the-data-studio-blog/pareto-graphs-in-tableau
Wednesday, December 8, 2010
Tuesday, December 7, 2010
Subscribe to:
Posts (Atom)